The famous economist Peter Drucker once said, “Once you don’t measure the indicators, you won’t be able to improve them”.
Without data loss, it is difficult for any marketer to build and implement SEO marketing strategies. Tracking the numbers, tracking the effectiveness of activities and work progress makes data analysis especially valuable in the eyes of business executives.
According to HubSpot , up to 61% of respondents consider generating traffic and reaching potential customers as the biggest challenge in marketing. When things come to a standstill, people often ask themselves if what they are doing is really the right thing to do and add value to the business.
Therefore, identifying and using data appropriately is an extremely important thing in digital marketing .

This comprehensive guide will give you the most complete look at Google Analytics, the best free data analytics platform available today, as well as, the strengths that SEO can bring, so that businesses can take advantage of it to enhance its competitive advantage.
>>> The most basic concepts of Marketing that you need to understand: Marketing mix ; 4Cs ; Online Marketing
What is Google Analytics? What can help with SEO?
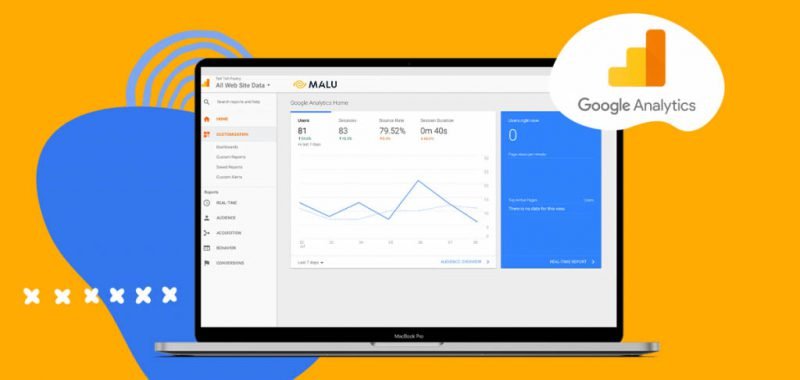
Google Analytics is a free software and tool from Google that provides huge amounts of data and information that can help businesses learn about how users interact with their website.
For example, with Analytics, you can completely track the number of people visiting a particular page in your website, the time they visit, the location of the visitor, the performance of the keywords and much more. .
This information is valuable in determining the effectiveness of your current SEO strategy, helping businesses find problems and make changes and adjustments accordingly.
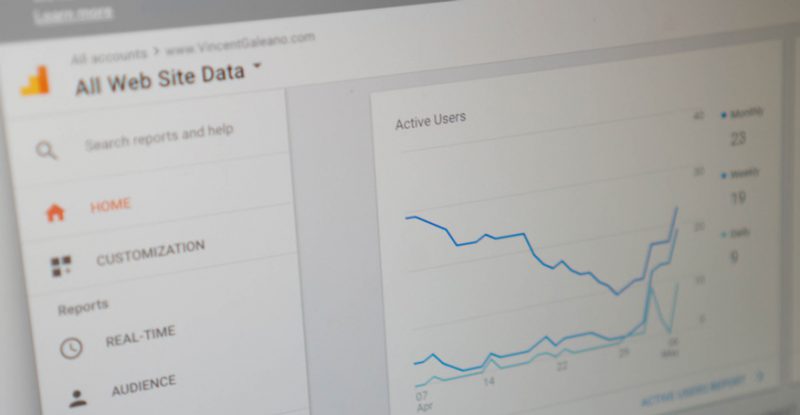
Google Analytics is obviously very important to the SEO performance of every business. So what can you gain from this tool?
A. Real-time Reports:
This Analytics built-in report can provide you with real-time website metrics.
You have just published a new article on your website, but it is not clear how many people are reading that article? Or do you want to find out how many users are watching the video you just uploaded? With real-time reporting, that problem is solved.
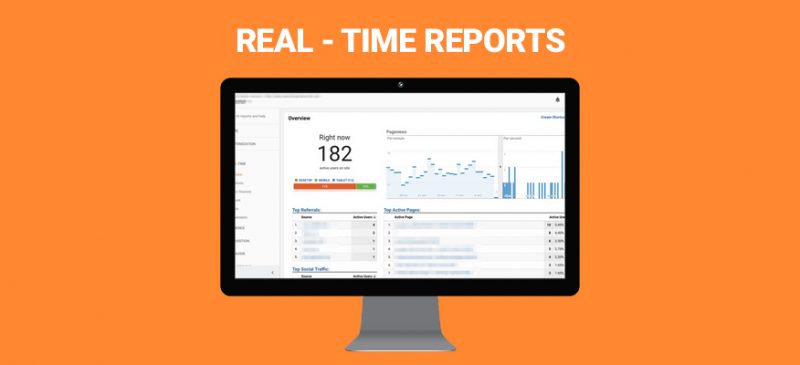
To access the amount of data in real time, simply click on “Real-Time” in the left sidebar. In most cases, real-time metrics will show website activity within the last 5 minutes. Some reports will collect data from the previous 30 minutes.
Let’s explore the different reported data in this section:
1. Location (location):
Are the number of visitors to the website located in different geographical areas, using different languages? In this data sheet, you will find out all the above information.
2. Traffic source:
This report will find out how users find your business website? Did they find you through a link on Facebook, search on Google, or click directly through the URL?
This report is especially useful when analyzed in real time, especially when you want to track the performance of your posts on social media platforms, or how your landing page is performing.
3. Content (content):
This section will find out exactly which pages users frequently visit on your website, and how long they visit it.
4. Events (events):
With the Events section, you can completely track the effectiveness of the events you run on your website, including user clicks on ads, video views, file downloads, and more.
You can even track user activity with programs within the last 30 minutes to track the event’s performance in real time.
5. Conversions (conversions):
In real time, or in the last 30 minutes, you can calculate the number of conversions from visitors, to customers buying (or using services) on your website, and compare them with your KPIs . previously set forth.
B. Audience Reports:
This report will provide businesses with all the information related to the number of users accessing the website: How many visitors in a certain period of time? How many of them convert into business customers?
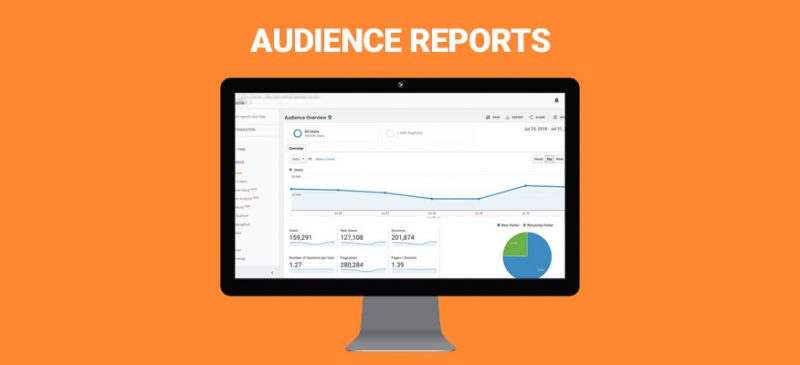
From here, you can adjust the orientation, to a more reasonable target audience for your business.
There are two points to keep in mind:
- You need to define the audience you want to track.
- Google recently released a brand new audience report, which can help you track how many users are interacting with ongoing and recently launched business marketing campaigns.
1. Active Users (Active Users):
This report allows you to track the number of users who visited your website during the last 1, 7, 14 to 30 days.
These parameters help you measure the user’s interest in the content of the website. For example, if the number of active users in 1 day is high, but suddenly decreases in 7, 14 or 30 days, it means that the content provided by the website is not really attractive and not enough to attract customers. draw the reader in for a long time.
2. Lifetime Value (Lifetime Value):
Are you wondering if the number of potential customers you reach through email marketing campaigns has much value? Is it worth spending the extra money on social media marketing?
The lifetime report will calculate to help you the value of the users you reach in the long term, through various metrics, from social, direct, organic to referrals (through referrals).
You can also prioritize the priority of your customers, and track parameters related to them, such as goals, page views, revenue, etc.
3. Cohort Analytics (Group Analytics):
Cohort is a group of users who share similar personality traits. For example, the number of users who visit the same website during the same time period.
This report is very helpful in planning and setting up marketing strategies suitable for groups of users with similar characteristics. The effectiveness of those strategies will also be significantly enhanced, if businesses know how to take advantage of those common points.
4. Audiences (objects):
An audience report inside an audience report? It sounds crazy, but it’s true.
This report allows you to reach a more specific, specialized user base. Often this customer group must be a close group of customers, VIP customers, often visit the website, and require your business to have “special” care than other target groups.
5. User Explorer (Explore User Behavior):
This report helps you to dig deep into user behavior, rather than just looking at general characteristics from Group Analysis.
Therefore, you can fully take advantage of the parameters in this report to add new features, help promote customer purchases, or prevent the behavior of “putting goods in the cart”. do not continue with the purchase process, which is common in current e-commerce sites.
6. Demographic (Demographic):
This section provides information about the age and gender of the user group accessing the website. For example, you can completely find out how much time the average female customer group, between the ages of 25 and 34, visits your website.
This is a great way to tailor your content, ads, and marketing campaigns to different audiences.
Or based on these parameters, you can design different marketing campaigns, suitable for each audience to bring the highest efficiency.
7. Interests (Hobbies):
You want to build specialized content marketing for technology enthusiasts, but really don’t know how many customers to target? Don’t worry, because Google Analytics has the solution for you.
>>> What is Content Marketing? Build an effective content strategy
To use it, you need to enable the “ Marketing and Advertising reporting ” feature in Google Analytics.
Once enabled, you can access user data such as:
- Affinity categories: General interests, like “food and cooking enthusiasts” and “shopaholics”.
- In-market Segments: Interests related to commercial products/services, such as: “like to use 4K TV”, “love iPhone”.
- Other categories: Other interests such as: “love dogs”, “regular facials”.
This information is really helpful in planning a reasonable marketing and remarketing strategy.
8. Geo (geography):
The parameters in this section help you approach issues related to the geographical location and language of website visitors. From there, you can come up with a reasonable marketing plan and activity.
9. Behavior (behavior):
This report helps you identify factors that help engage new users with the content your website has to offer.
This item data is divided into 3 levels: New with Returning, Frequency with Recency, and Engagement.
You absolutely use these parameters to read the buying behavior of customers, to plan the appropriate marketing strategy, as new customers will have different promotions from the familiar customers.
10. Technology:
This report will provide businesses with the technology platform that customers use to access the website, from the traditional browser to the operating system they use, connecting to LAN or using Wifi, 3G?
11. Mobile:
The parameters in this section represent the mobile platform that the user is using to access the website, such as tablet, mobile phone. More specifically, the data also indicates which device the user is using specifically, like the Apple iPad, or the Samsung Galaxy S8?
Businesses can completely use this data source to calculate a reasonable resource allocation in calculating the web interface according to the specific mobile device platform.
12. Custom:
This section of Analytics helps you locate and compare metrics across different customer groups.
For example, you can compare the bounce rate between mobile users and customers who have made payments on your website, or compare what percentage of organic traffic is visitors. new products.
You can sort data through features like “Custom variables” (compare optional variables), or “User Defined” (define the group of customers to compare).
The information returned from this section is often very detailed, allowing you to shape how your customers interact with your website.
13. Benchmarking (benchmarking):
This item has a broader scope. allows you to compare your data with the general data of other websites in the market.
Items you can compare include: Channels, Location, and Devices. You can find potential opportunities through this comparison activity.
14. Users Flow (user flow):
What do customers do when they visit your website?
This report will show the “flow” that customers will make when accessing your website. For example: When accessing the website, customers will first click on the clothing product category, then select the trending section, etc.
This parameter helps businesses arrange the elements for the website in the most reasonable way, in line with the shopping behavior of customers and ensure to promote conversion rate on e-commerce sites.
C. Acquisition Reports (conversion reports)
The reports in the form of acquisition will show businesses clearly how customers find your website, the process of accessing, and performing activities on it (such as making transactions, filling out forms, …).
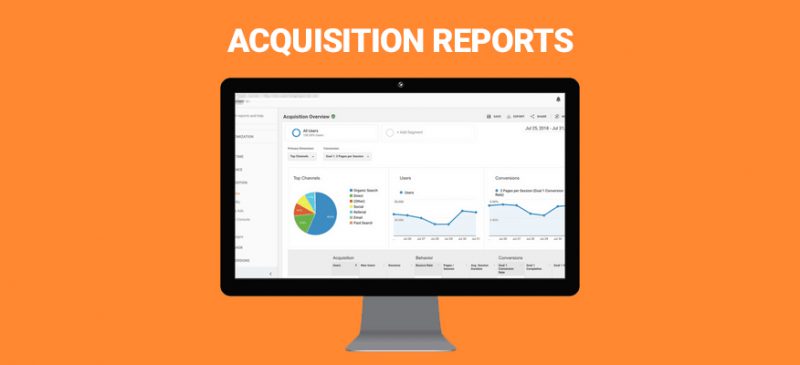
1. All Traffic (all traffic):
This section will provide all information related to website traffic. The data you can collect here includes: bounce rate, page per visit, goal completions, …
In addition, data can also be divided into different groups, such as Channels or Source/Medium.
2. Google Ads:
If your website runs Google Ads, the parameters in this section are especially important for measuring how well your website is performing.
First, you need to link your Google Ads and Google Analytics accounts. Next, the data you can access includes:
- Campaigns.
- Keywords.
- Search queries (search queries).
- The hour of the day (ads parameters are calculated by the hour of the day).
- Final URLs ( final URLs ).
>>> What is SEM? Why do SEM in the Digital Age?
3. Search Console:
This report helps you understand the performance of your website, measured by organic search. First, you need to connect your Google Search Console and Google Analytics accounts.
Once connected, you have access to a huge amount of data related to website performance, according to organic search on Google. You can completely filter data based on landing pages, country, device platform, etc.
4. Social:
The Social section allows you to access parameters related to user interaction with content on social networking platforms.
The data can be filtered by:
- Social networking platform.
- Landing pages.
- Conversions.
- Plugins.
- Users Flow.
Use this data source to allocate resources to social networks, see which platforms are best for your business, measure the impact of social networks on customer buying behavior and website visits.
5. Campaigns (campaign):
The campaigns report provides the performance of marketing campaigns, as well as comparing them to other media campaigns.
Data can be filtered by:
- All Campaigns.
- Paid Keywords.
- Organic Keywords.
- Cost Analysis.
You can completely analyze the effectiveness of marketing campaigns using platforms other than Google, as long as you update the parameters related to the campaign’s budget.
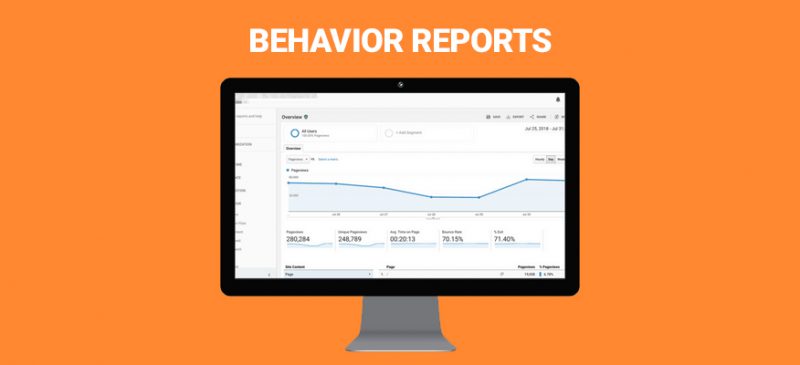
D. Behavior Reports
With behavior reports, businesses can gain access to information related to users’ activities on the website, including searches, content they follow, site loading speed, and more. .
This is an effective way for you to find the cause of your website not working as expected.
1. Behavior Flow:
This report shows the flow of behavior that customers perform when accessing the website.
For example, do users read a review post about mobile phone trends this year, before making a purchase on the website? To enable this report, you need to open and monitor the Events report.
2. Site Content (website content):
Site Content provides an in-depth analysis of the effectiveness of the articles/content on the website. The report explores customer behavior on mobile / desktop platforms, customers who have / have not transacted on the website, and so on.
3. Site Speed (site speed):
This report shows businesses whether the page loading speed on the website is fast or slow. This report even breaks down page load speed by device platform, such as mobile or desktop.
4. Site Search (site search):
Businesses can find out the search behavior of customers on the website through the site search section.
With the parameters obtained, you can completely design the keywords (and the results returned) so that it is most convenient and friendly for users accessing the web.
5. Events (events):
Google Analytics defines events as user interactions with content that can be independently tracked from a website.
Simply put, these independent interactive activities can be downloading a pdf file, watching a video (with externally embedded source), filling out a form, etc.
You can filter parameters from this entry through aspects such as:
- Top events (top events).
- Pages.
- Event flow (event flow).
6. Publisher (publisher):
This report provides businesses with impressions and click-through rates. Of course, to run this report, you need to connect your Analytics account to your AdSense or Ad Exchange account.
7. Experiments (experiment):
This section allows you to run different tests on your website, compare them and decide which change works best.
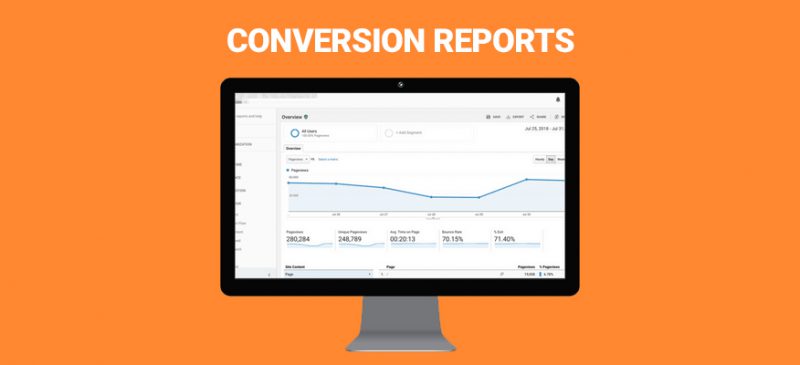
E. Conversions Reports
Conversion reports give businesses a detailed and specific view of the conversion activities of customers on the website. How many people decide to buy after surfing the information on the website? Percentage of subscribers to receive mail of the business?
1. Goals (goals):
Goals here are the goals of the customers you want to track on the website.
The metrics in this report allow you to understand how your customers’ day-to-day behavior on the web affects their purchase/conversion behavior.
For example: If a customer attentively reads reviews of the hottest phones of 2019, would they point to the product page and make a purchase?
You can find more information about Goals on Analytics here .
2. Ecommerce (e-commerce):
This section is especially useful for websites that integrate online business platforms. You can track parameters related to:
- Product.
- Sales.
- Transaction.
- Transaction time.
3. Multi-Channel Funnels (multi-channel channels):
This section is relevant to understanding how advertising and user engagement impact their website conversion and transaction behavior.
To better understand multi-channel funnels, you can learn more here .
4. Attributes (attributes):
An attribute or attribute is a parameter expressed in the form of a point of credit. When you compare your target’s activities to determine which one leads to more conversion and transaction behavior on your website. From there, you have the right attribution adjustments to drive customer buying behavior.
You can find out more information about Attribution here .
Conclusion
For SEO professionals, it is extremely important to understand and take advantage of all the tools in Google Analytics. Because Analytics not only helps you understand what is most important in SEO, it also explains the root cause of the problem and gives you a logical solution to the problem.
Hopefully, the above information has provided you with the most complete information about Google Analytics, on how to collect, utilize, analyze data and set up SEO marketing strategies that are reasonable and most effective. .

