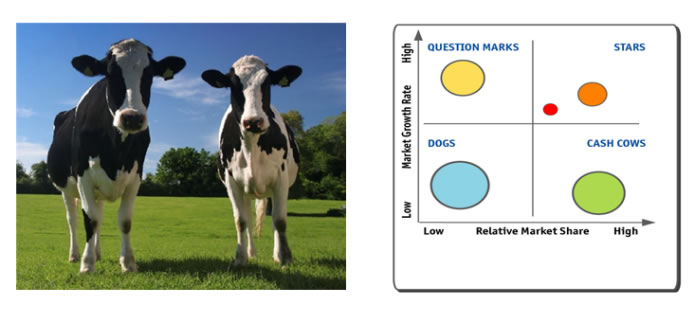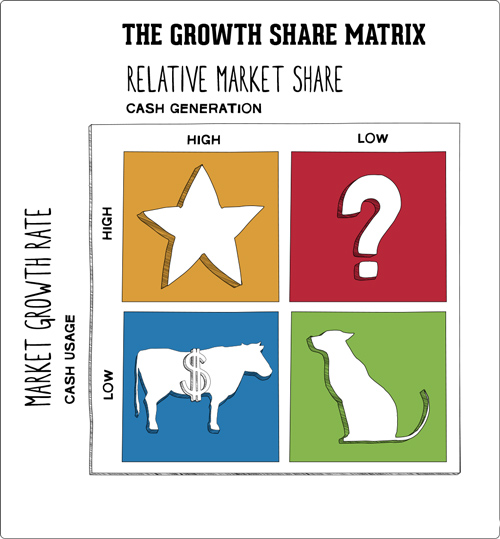
The Boston Matrix is a classic theoretical model of the life cycle of a product (or a brand), made by researchers at Boston Consulting Group more than 40 years ago. To this day, the Boston matrix is still an important tool, widely used in marketing and in business strategy analysis at large enterprises around the world.
A business often has many different categories of goods and products. However, the diversity in this portfolio raises a big problem: How to divide the investments for each commodity portfolio so that it is reasonable and correct?
>>> Learn the basics of Marketing: Marketing mix ; Marketing Model 4Cs
What is the Boston Matrix?
The solution to the above problem lies in the use of the Boston matrix (also known as the BCG matrix). In this matrix, we will deeply analyze two aspects of this matrix (corresponding to the vertical and horizontal axes of the matrix), namely:
- Market share: Currently, the market share of the product in the market is low or high.
- Market growth: The number of potential customers in the market with growth prospects or not.

How to set up the Boston matrix
Combining the elements in the matrix, we have the following conclusions:
1. Star: Represents products that can compete well in the market, which has other strong competitors. Often products in this quadrant need huge investments to maintain their growth.
When the growth rate of the product declines, the product becomes dairy if it maintains a large share of the market.
2. Dairy cows: Represents products with low growth rate, but still holds a large share of the market. In this quadrant, the product already has a strong foothold in the hearts of customers, so it needs just enough investment to maintain a competitive advantage.
Of course, businesses need to maintain the foothold of products in this area, in order to have a good source of profit to have money to invest in the stars.

3. Question mark: Represents products located in the market with high growth rate, but has only a limited market share. The problem here is that this product may have potential in the future, but it requires a relative investment to compete with the strong competitors out there.
Whether to invest heavily in products, or quietly withdraw to preserve capital, is a big question mark for portfolios in this quadrant.
4. Dogs (also known as squid dogs in some documents): Represents products that fall into unattractive markets with low market shares in those markets. Often with these products, businesses rarely invest money in them. If there is, they just try to recover enough capital to withdraw in time.
The classification of business product categories in the BCG matrix will help you understand the life cycle of products, allocate and balance investment capital appropriately.
>>> What is KPI? Building KPIs in the business ; The concept of M&A in business
The meaning of the Boston matrix:
1. An effective tool in deciding on the appropriate allocation of investment resources.
2. But it is only a small slice of the current problem picture.
3. The BCG matrix has little predictive value for the future.
4. Not paying attention to aspects related to the external environment.
5. There may be errors based on the assumptions made from the matrix.
Some issues related to the use of the Boston matrix:
1. Market growth may be an inadequate measure of market attractiveness.
2. Market share is a measure of a product’s ability to generate money.
3. Focusing only on market growth and market share will make businesses ignore other factors that can affect the sustainable development of their products (such as unique competitive advantages).
4. The life cycle of product categories may not be the same and fall to a certain standard.
>>> What is SWOT? How to do a SWOT analysis?
Here are a few assessments of the elements of the Boston matrix:
1. Star:
- Strong growth market.
- Occupy a large market share.
- Earn the average amount of money.
- Continue to invest.
It is necessary to promote the Star group by focusing maximum marketing resources to ensure this product group accelerates as quickly as possible to capture market share and bring in as high sales as possible.
Because this is a group of products that are being actively welcomed by the market, if you do not focus on promoting, you will waste opportunities and give way to competitors.
2. Dairy cows:
- Market growth is slow.
- Occupy a large market share.
- Earn large amounts of money.
- Continue “milking”.
Dairy cow group can’t grow any more, but the market share is still and is still steadily bringing a significant source of money, so we only need to provide moderate resources to maintain and limit the decrease in market share ( like the image of a dairy cow, just feed some grass and milk as much as possible).
3. Question mark:
- Strong growth market.
- Low market share.
- Earning low amount of money.
- Continue to build the brand.
Question Mark group is a new product group, we need to push trial marketing in a short time, actively monitor and analyze which products have good responses, which marketing channels are effective, then put that product in the Star group. to boost marketing.
Products that do not sell despite trying different marketing methods are put in the Squid Dog group to save money on it. The rest are put in the Dairy Cow group to find ways to exploit more.
4. Squid dog:
- Market growth is slow.
- Low market share.
- Earning a medium amount of money.
- Should divest.
The Squid Dog group is a group that does not bring benefits to the company anymore, so don’t waste money on useless marketing, remove this product group as soon as possible to avoid unnecessary expenses (existence). warehouse, preservation, management, inventory, control, …)
>>> 2 Basic Business Models: B2B and B2C
The Boston matrix is also applied in many different cases and fields such as: production, human resources, investment, management… As long as we pay attention, we can skillfully apply it to optimize our resources. The most effective way.
Hopefully, the above article has provided you with the most basic knowledge about the Boston – BCG matrix. Check out other great articles on Marketing and Business on Malu’s Blog .


